What Is Bounce Rate? Definition and Why It Matters Less Than You Think
Bounce rate is one of the most misunderstood metrics in web analytics. Marketers obsess over it, and executives demand it be “fixed.” As a result, entire optimization strategies get built around lowering it. However, here’s the thing: a high bounce rate isn’t always bad. Moreover, in Google Analytics 4, the metric works completely differently than it did before.
In this guide, I’ll explain what bounce rate actually measures. Additionally, I’ll cover how it changed in GA4, when you should care about it, and when you’re better off ignoring it entirely.
What Is Bounce Rate?
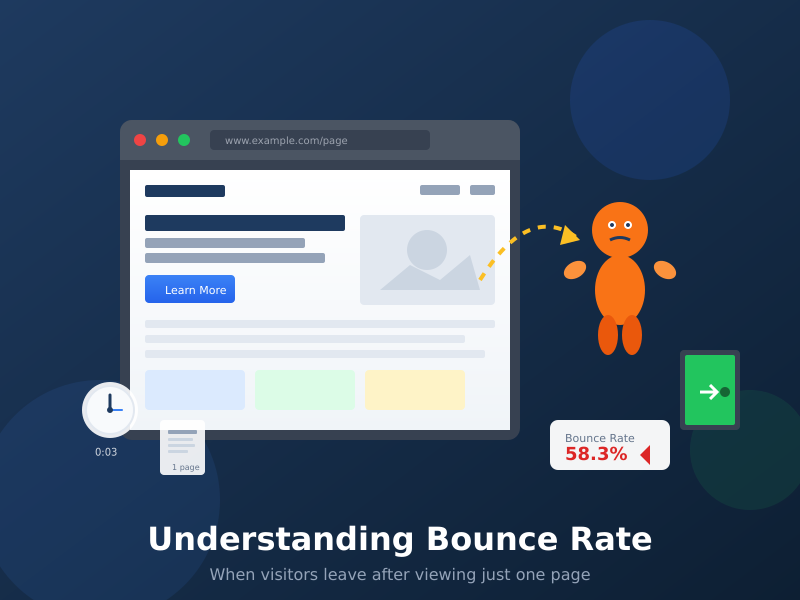
Bounce rate is the percentage of visitors who land on a page and leave without taking any further action. In other words, they “bounce” off your site like a ball hitting a wall.
The basic formula looks simple:
Bounce Rate = Single-page sessions ÷ Total sessions × 100%
For example, if 1,000 people visit your site and 600 of them leave without visiting a second page, your bounce rate is 60%.
However, this definition has a critical flaw—and Google eventually realized it.
The Old Definition vs. The New One
The meaning of “bounce rate” depends on which version of Google Analytics you’re using. This isn’t a minor technical detail. Instead, it fundamentally changes how you should interpret the metric.
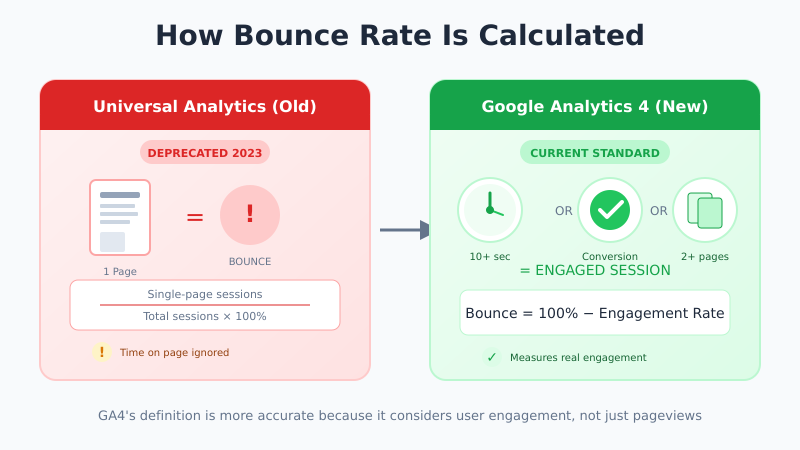
Universal Analytics (the Old Way)
In Universal Analytics (which Google sunset in July 2023), a bounce was any session where the user viewed only one page. It didn’t matter if they:
- Read your entire 3,000-word article
- Watched a 10-minute video
- Spent 15 minutes on the page
- Clicked an outbound link to buy your product
If they didn’t load a second page on your site, it counted as a bounce. Consequently, this created absurd situations where deeply engaged readers looked identical to people who left after two seconds.
Google Analytics 4 (the New Way)
In GA4, bounce rate is calculated differently. Specifically, a session counts as a “bounce” only if it was NOT an engaged session. According to Google’s documentation, an engaged session is one that:
- Lasted longer than 10 seconds, OR
- Had a conversion event, OR
- Had 2 or more page views
Therefore, the formula becomes:
GA4 Bounce Rate = 100% − Engagement Rate
If someone reads your blog post for 3 minutes but never clicks to another page, that’s NOT a bounce in GA4. Instead, it’s an engaged session.
Bounce Rate vs. Engagement Rate: A Comparison
Here’s how the two metrics relate in GA4:
| Metric | What It Measures | Good/Bad |
|---|---|---|
| Engagement Rate | % of sessions that were “engaged” (10+ sec, conversion, or 2+ pages) | Higher is better |
| Bounce Rate | % of sessions that were NOT engaged | Lower is better |
If your engagement rate is 65%, your bounce rate is 35%. They’re two sides of the same coin.
In my experience, engagement rate is more useful for most analyses. It’s a positive metric (higher = better) that directly measures what you want: people actually engaging with your content.
What’s a “Good” Bounce Rate?
This is the question everyone asks. However, it’s the wrong question.
Bounce rate benchmarks vary wildly by several factors:
- Industry — E-commerce sites typically have lower bounce rates than blogs
- Page type — Landing pages behave differently than product pages
- Traffic source — Organic search traffic bounces differently than social media traffic
- Device — Mobile users often have higher bounce rates
- Analytics setup — UA vs GA4 produce completely different numbers
That said, here are rough benchmarks for GA4 bounce rates:
| Page Type | Typical GA4 Bounce Rate |
|---|---|
| E-commerce product pages | 20–45% |
| Lead generation pages | 30–50% |
| Content/blog pages | 40–60% |
| Landing pages (ads) | 60–90% |
| Single-page tools | 70–90% |
Important: These are general ranges. Therefore, compare your bounce rate to your own historical data, not to arbitrary benchmarks. For more context on benchmarks, see our guide on conversion rate benchmarks by industry.
When Bounce Rate Matters (And When It Doesn’t)
Here’s the nuance most guides miss: bounce rate is useful for some pages and meaningless for others.
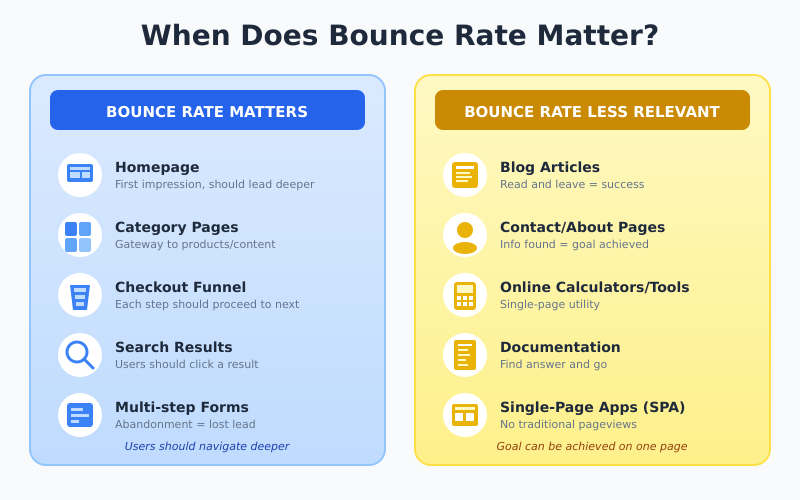
When Bounce Rate Matters
Bounce rate is important in these situations:
- Multi-step funnels — If users need to navigate through multiple pages (checkout, onboarding), high bounce rate indicates a problem
- Homepage — Your homepage should direct visitors deeper into your site
- Category pages — Users should click through to products or articles
- Search results pages — Internal search should lead somewhere
When Bounce Rate Doesn’t Matter
On the other hand, bounce rate is less relevant for:
- Blog articles — Readers may consume your content fully and leave satisfied
- Contact pages — Users find your phone number or address, then call you
- Single-page applications — SPAs don’t trigger pageviews for navigation
- Tools and calculators — Users complete their task on one page
- Documentation pages — Developers find the answer they need and leave
For example, a 90% bounce rate on a helpful FAQ page might be perfectly fine. In contrast, a 90% bounce rate on your checkout page is a disaster.
How to Find Bounce Rate in GA4
Bounce rate isn’t shown by default in GA4 reports. Here’s how to add it:
Method 1: Customize Existing Reports
First, follow these steps:
- Open any report in GA4 (e.g., Pages and screens)
- Click the pencil icon (Customize report) in the top right
- Click “Metrics” in the Report Data section
- Click “Add metric” and search for “Bounce rate”
- Finally, click Apply, then Save
Method 2: Use Explorations
Alternatively, you can use Explorations:
- Go to Explore → Blank exploration
- Add dimensions: Page path, Landing page, etc.
- Add metrics: Bounce rate, Sessions, Engagement rate
- Drag dimensions and metrics to build your report
How to Improve Bounce Rate (When You Should)
If you’ve determined that bounce rate matters for a specific page, here are practical ways to improve it:
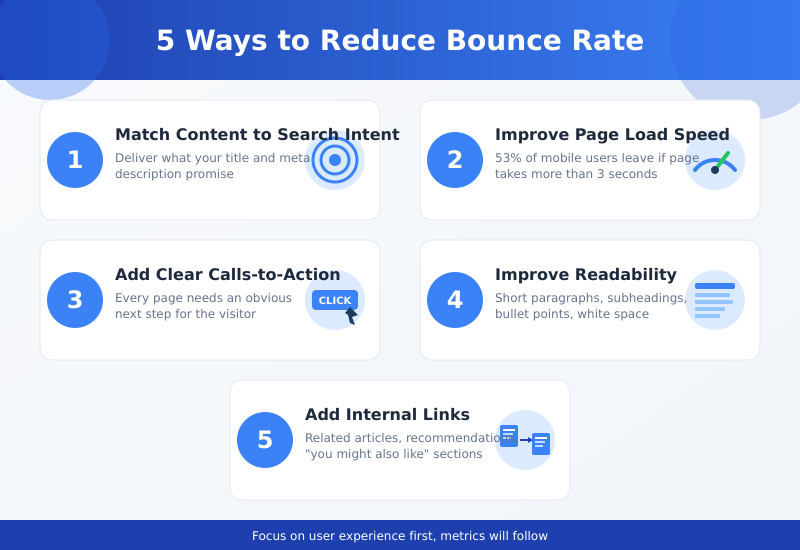
1. Match Content to Search Intent
The #1 reason for high bounce rates: visitors don’t find what they expected. For instance, if someone searches “how to tie a tie” and lands on a page selling ties, they’ll leave immediately.
Fix: Review your top landing pages. Does the content deliver what the page title and meta description promise?
2. Improve Page Load Speed
Slow pages cause bounces before users even see your content. According to Google, 53% of mobile visits are abandoned if pages take longer than 3 seconds to load. This is similar to how crawl budget is affected by server speed.
Fix: Test your pages with PageSpeed Insights and address critical issues.
3. Add Clear Calls-to-Action
If visitors don’t know what to do next, they leave. Therefore, make the next step obvious.
Fix: Every page should have a clear CTA—read another article, view a product, sign up, or contact you.
4. Improve Readability
Walls of text scare people away. Large paragraphs, tiny fonts, and poor contrast all increase bounce rates.
Fix: Use short paragraphs, subheadings, bullet points, and adequate white space.
5. Add Internal Links
Give visitors paths to explore. Related articles, product recommendations, and “you might also like” sections all reduce bounces.
Fix: Add 3-5 contextual internal links per page.
Common Bounce Rate Mistakes
Avoid these traps when working with bounce rate:
- Comparing UA to GA4 numbers — They use different definitions. A 70% bounce rate in UA might become 45% in GA4.
- Looking at site-wide bounce rate — Aggregate numbers hide what’s actually happening. Instead, analyze by page, traffic source, and device.
- Ignoring context — A “bad” bounce rate on one page type might be excellent on another.
- Optimizing bounce rate as a goal — Focus on business outcomes (conversions, revenue) instead. Bounce rate is a diagnostic tool, not a KPI.
Related Metrics to Track
Bounce rate works best alongside other engagement metrics:
| Metric | What It Tells You |
|---|---|
| Engagement rate | Inverse of bounce rate—often more useful |
| Average engagement time | How long users actively spend on your site |
| Pages per session | How deeply users explore |
| Exit rate | Where users leave (different from bounce rate) |
| Scroll depth | How far users scroll down the page |
Together, these metrics paint a complete picture of user engagement.
Bottom Line
Bounce rate measures the percentage of sessions where visitors leave without engaging. In GA4, “engagement” means staying 10+ seconds, triggering a conversion, or viewing multiple pages.
The metric matters for pages where you need users to take a next step—homepages, category pages, and checkout flows. However, it matters less for content pages, tools, and single-page experiences where users can accomplish their goal without navigating further.
Most importantly, don’t chase arbitrary benchmarks. Instead, compare your bounce rate to your own historical performance. Segment by page type and traffic source, and focus on the pages where reducing bounces actually drives business results.
Related: Conversion Rate Benchmarks by Industry — understand what “good” conversion rate actually means for your business.