Conversion Rate Benchmarks by Industry in Plain English: How to Compare Your Site Without Fooling Yourself
Conversion rate sounds complicated, but the idea is simple.
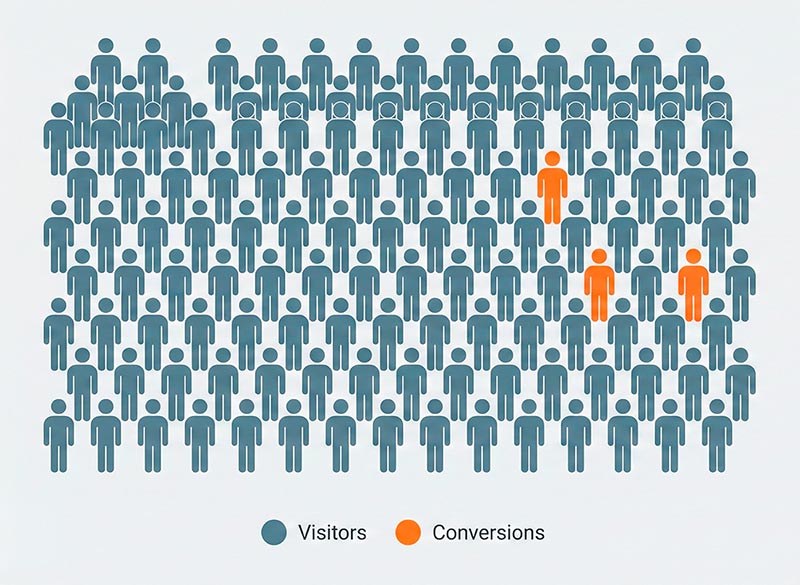
Imagine 100 people walk into a store. If 3 people buy something, the conversion rate is 3%.
Websites work the same way. Out of all visitors, some do the action you care about: buy, fill in a form, sign up, download, call, and so on.
If you have ever typed “what is a good conversion rate” into Google, you already know how confusing the answers can be. Some articles say “1–2% is normal”, while others say “aim for 5%+”. And then there are giant tables for every industry.
In this article I’ll explain things as a technical analytics specialist, but in plain English so even an 8th-grader can follow:
- what a conversion rate really measures (and what it doesn’t);
- why numbers are so different from one industry to another;
- how benchmark reports are built and where their limits are;
- how to decide if your number is “okay”;
- how to use benchmarks in real life, not only in pretty slide decks.
What a Conversion Rate Actually Measures (and What It Doesn’t)
The Basic Formula in Everyday Language
The formula for conversion rate is:
Conversion rate = (number of conversions ÷ number of visits) × 100%
Here’s a simple example:
- 200 people visited your site in one day.
- 4 of them bought something.
Therefore:
- 4 ÷ 200 = 0.02
- 0.02 × 100% = 2%
Your conversion rate is 2% for that day.
You don’t need any special math skills; it’s just division and percentages.
A Conversion Is Not Always a Sale
Important: a “conversion” is not always a purchase.
On different sites a conversion can be:
- buying a product in an online shop;
- sending a contact form;
- signing up for an account;
- requesting a demo;
- downloading a file;
- subscribing to a newsletter.
Sometimes a website has one main goal (for example, a paid order). However, sometimes there are several important goals.
To stay sane, it helps to think about two levels:
- Main conversion – the thing your business really wants (purchase, paid subscription, demo request, qualified lead).
- Small steps – actions that move people toward the main goal (add to cart, start checkout, sign up, watch key video).
For example, a shopping journey might look like this:
- Visit the website
- View a product page
- Add to cart
- Start checkout
- Pay for the order
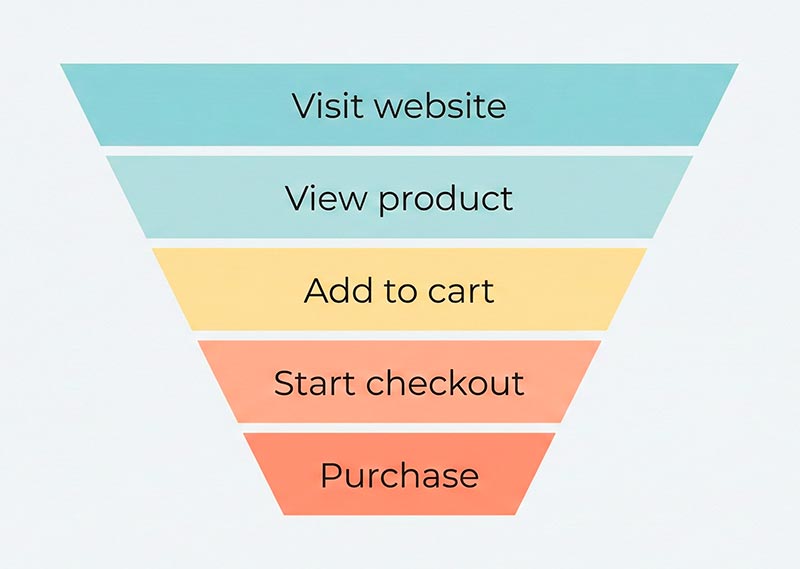
You could treat each step as its own conversion. However, usually there is one primary conversion (for example, a paid order) that you use for high-level comparison.
Why Different Industries Have Different “Normal” Numbers
People often compare their numbers with some benchmark and panic:
“That report says 4%. We only have 1.5%. Are we failing?”
Don’t rush to that conclusion. Many things push conversion rates up or down.
Factors That Move Conversion Up and Down
Here are a few big ones:
- Price and risk — Cheap, low-risk products usually convert better than complex and expensive ones. For instance, a coupon for a pizza can be an impulse decision. In contrast, a business software platform can take weeks of thinking and approvals.
- Time to make a decision — Simple purchases happen quickly: “I like this T-shirt, I’ll buy it now.” However, complex services require the visitor to read, compare, talk to a partner or boss, and maybe sign a contract.
- Traffic source — Visitors arrive in very different moods. Some already know and trust your brand, while others land on the site from a random ad. Additionally, some come to read your blog and are not ready to buy yet. As a result, the same website can have very different conversion rates for different traffic sources.
- Device and usability — Often it’s easier to buy on desktop than on a small phone. If your mobile version is hard to use, mobile conversion will drop.
- User intent — Someone who searches “buy blue running shoes size 42” is much closer to paying than someone who searches “how to start running”.
The important point: you can’t compare two conversion rates without thinking about what people are buying, how they arrive, and how hard it is to say “yes”.
Simple Industry Groups
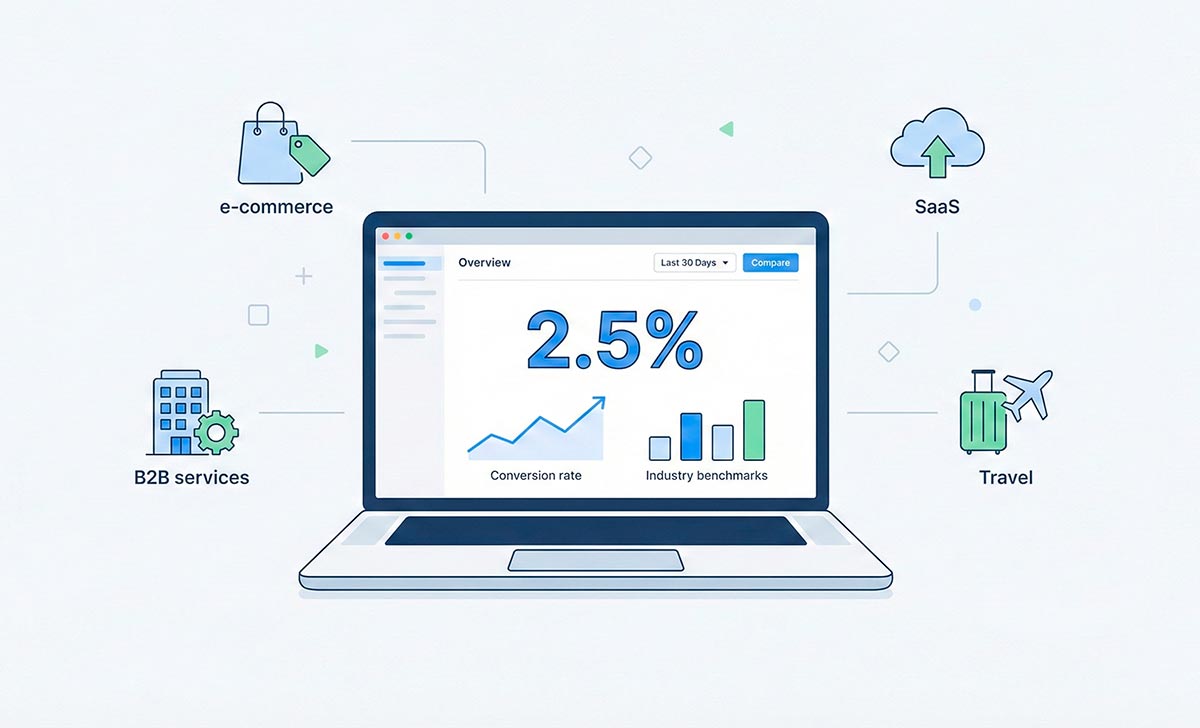
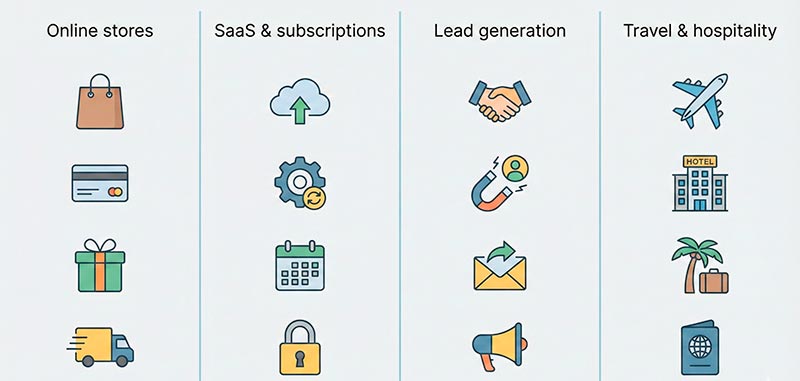
Instead of 100 tiny industries, it’s easier to think in a few big groups:
- Online shops and physical products — Focus on catalog, filters, product pages, cart, promotions.
- SaaS and subscriptions — People often test the product, invite teammates, and only then pay.
- Lead generation for services — Lawyers, repairs, agencies, consulting. The website collects leads, and the actual sale happens later in a call or meeting.
- Travel and hospitality — Hotels, tours, flights. People compare dates, locations, and prices before booking.
Each group has its own “normal” corridors. Therefore, the same percentage can mean very different things in different groups.
For example, online shops and marketplaces watch small changes in retail conversion rates very closely. Even a 0.5% improvement can mean a big jump in orders when traffic is large.
How Big Benchmark Reports Are Built (and Why That Matters)
You’ve probably seen articles with titles like:
- “Conversion rate benchmarks by industry”
- “Average numbers by traffic source”
- “Global comparison across hundreds of sites”
These can be useful. However, it’s important to understand what’s behind those numbers.
Where the Numbers Come From
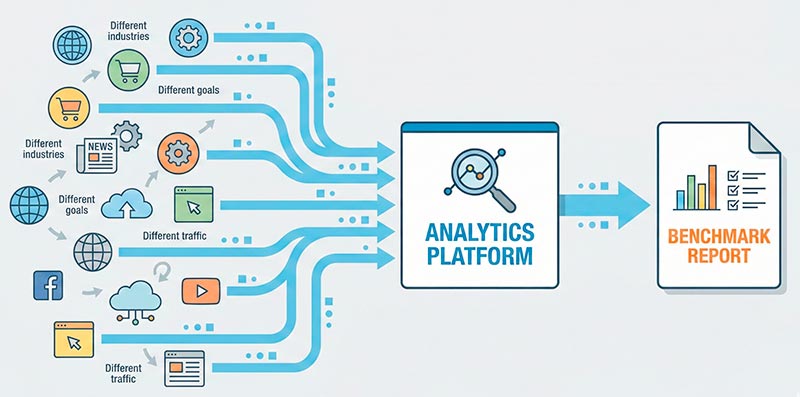
Usually companies that publish benchmark reports:
- take data from their own users or clients;
- group websites by industry, traffic source, region, device, and so on;
- calculate different statistics (conversion rate, average order value, etc.) over a period of time.
So when you see a table claiming an average conversion rate for a category, you are really looking at a summary of their data set, with their rules and filters.
It is not “the law of the internet”. Instead, it is just one picture based on one sample.
Common Traps When Reading Benchmark Tables
Here are some easy ways to misread those reports:
- Different definitions of “conversion” — One site counts only paid orders. Another counts any submitted order, even if payment fails. A third might count “add to cart” as a conversion. As a result, all three will show very different numbers, even if their real business performance is similar.
- Different traffic mixes — Some sites live on loyal returning customers and branded search. Others buy cold ads and have mostly first-time visitors. Consequently, putting them side by side as if they were the same can be very misleading.
- Data quality issues — Common problems include tracking not set up correctly, bots not filtered, and part of the sales happening by phone or offline (never hitting analytics).
- Overconfident headlines — A headline like “sales conversion rate by industry” looks very solid. However, behind it there are many choices: which industries are included, which goals are measured, what time period was used, and who was excluded from the dataset.
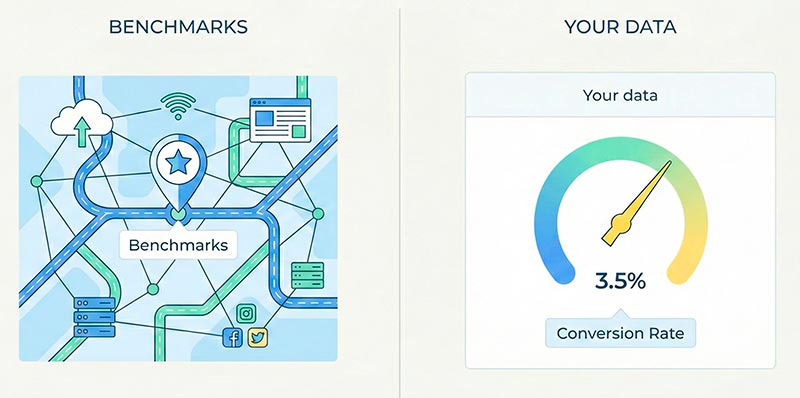
Because of this, benchmarks should be treated more like a map than a rulebook. They show a rough landscape, not the exact score you “must” reach. This is similar to how bounce rate benchmarks vary wildly by context.
Checklist: Is Your Conversion Rate “Okay”?
Now the practical part: how to decide if your own number makes sense.
Step 1. Decide What You Count as a Conversion
First, choose one main action that you will call a conversion right now:
- successful purchase and payment;
- submitted lead form;
- account signup and activation;
- newsletter subscription.
If you try to count “everything”, your number will be impossible to compare with anything.
Step 2. Make Sure Tracking Actually Works
Ask yourself a few simple questions:
- Is the goal or event properly set up in your analytics tool?
- Are test orders from your team excluded?
- Is the same action being counted multiple times by mistake?
- Do important pages load correctly, without hidden errors?
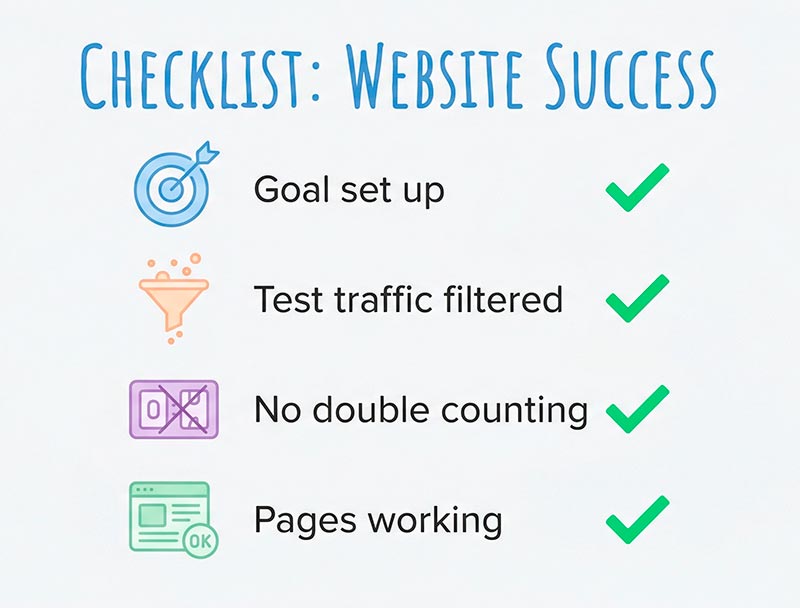
You don’t need to be a genius to check this. However, without it any number in the report is just an illusion.
Step 3. Calculate Your Own Number
Pick a time period, for example last month:
- total visits to your site;
- total number of main conversions (for example, paid orders).
Then apply the formula again:
conversion rate = (conversions ÷ visits) × 100%
If you had 5,000 visits and 100 purchases:
- 100 ÷ 5000 = 0.02
- 0.02 × 100% = 2%
Your conversion rate is 2% for that month. This is your personal starting point.
Step 4. Compare with Ranges, Not with a Single Magic Number
This is where panic usually starts:
“The report says 3%. We only have 1.5%!”
There is no single perfect number for everyone. Instead, it’s better to think in terms of ranges:
- “For businesses like mine, I often see something between X and Y.”
- “We are currently at the bottom / middle / top of that range.”
That way, you can honestly say whether you are at least near a typical conversion rate for a business similar to yours. You won’t be chasing some mythical “ideal” percentage.
Step 5. Look Deeper with Simple Segments
The overall conversion rate is just the surface.
Therefore, break your data into a few simple segments:
- by traffic source: search, ads, email, social, direct;
- by device: mobile vs desktop;
- by user type: new vs returning visitors.
For example, you might discover:
- desktop conversion is 3%, mobile is only 0.8%;
- your email list performs well, but cold ads perform poorly;
- returning visitors convert much better than first-timers.
You might also discover that your newsletter brings good leads, while your seo conversion rate is much lower and needs attention.
This kind of segmentation shows where the real problems and opportunities are hiding.
How to Use Benchmarks in Real Life
Benchmarks on their own don’t change anything. They only help if you use them wisely.
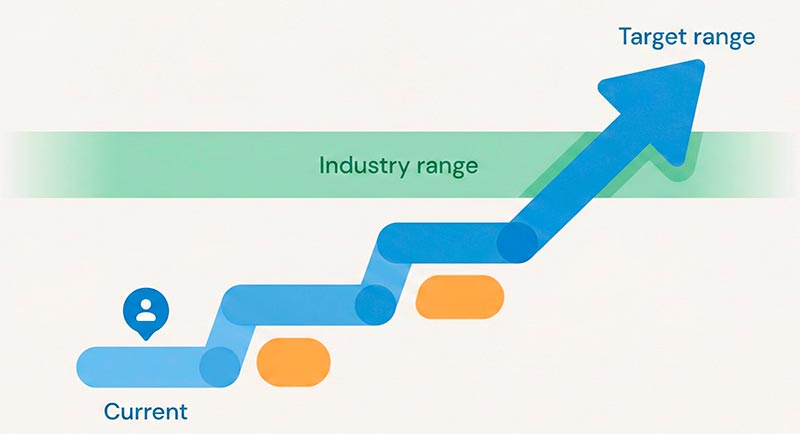
Setting Realistic Goals
Here’s an example:
- your current conversion rate is 1.2%;
- for similar businesses you often see numbers between 2–3%.
Instead of yelling “we need 5% right now”, a better goal is:
“Let’s reach the middle of this range in the next six months.”
This sounds more realistic and honest for your team.
Talking to Managers and Clients
When you have at least some idea of typical ranges, it’s easier to explain what is going on:
- “We are below common levels for mobile users; here are the pages with the biggest issues.”
- “This channel brings little, low-quality traffic, so we’re going to move part of the budget elsewhere.”
- “After changing our form and offer, we moved closer to the range we expect for similar companies.”
The point is not to hide behind statistics. Instead, use them as context for your decisions.
Choosing What to Improve First
If you have limited time and resources, benchmarks help you pick your first moves:
- optimize pages that get the most traffic;
- fix the channel that underperforms the most;
- look at device breakdown and start with the worst experience.
You don’t have to fix everything at once. Instead, small, focused improvements add up over time.
Short FAQ in Simple Language
By itself, the number doesn’t mean much. For one business, 2% is great. For another, it is weak. You need to look at your industry, prices, traffic sources, and type of website, and also compare with your own past results: are you growing or falling over time?
An online shop sells directly on the site, often low or mid-priced items. A consulting company usually sells later, through calls and contracts, and the site just collects leads. Of course their percentages will be different, because the path to money is not the same at all.
At least once a month. Once a week is even better for your main metrics. If you launch a big campaign or ship major design changes, it’s smart to watch the numbers more closely for the first few weeks.
Not really. A high rate may mean you are doing many things right, but there is almost always room to improve: reach more people, test new offers, fix mobile UX, try new channels. The danger is to stop thinking just because the charts look nice.
Don’t panic. Treat it as a list of questions: is tracking correct, is the path to the goal too long or confusing, are there technical errors, is the traffic really interested in your offer? In most cases, low numbers are not a sentence, they are a signal to investigate.
Bottom Line
Conversion rate is not a grade that says “you are good” or “you are bad”. Instead, it is a signal that helps you notice where your website is working well and where something is broken or confusing.
Benchmarks and industry reports are useful as background. They show what happens for other businesses. However, they know nothing about your exact product, your audience, your prices, or your traffic mix.
Therefore, treat them like a map: good to have, but you still need to watch the actual road in front of you.
Most importantly, what really matters is how you work with your own website conversion rates:
- you check that tracking is correct;
- you calculate your numbers honestly;
- you compare sensible segments;
- you make small, concrete improvements and watch how they change the results.
Do that consistently, and benchmarks will stop being a source of stress. Instead, they will turn into a helpful reference point for better decisions.
Related: What Is Crawl Budget? — understand how Google allocates resources to crawl your site and when it actually matters.