What Is A/B Testing?
A/B testing (also called split testing) is a method of comparing two versions of a webpage, email, or other marketing asset to see which one performs better. You show version A to half your audience and version B to the other half, then measure which version achieves more conversions.
The concept is simple. However, running A/B tests correctly is surprisingly difficult. Most businesses make fundamental mistakes that lead to false conclusions and wasted effort.
In other words, they think they’re making data-driven decisions when they’re actually just fooling themselves. This guide walks through how A/B testing works, how much traffic you really need, the statistical traps that quietly invalidate most tests, and the alternatives worth considering when classic A/B testing isn’t a fit.
How A/B Testing Works
The basic process looks straightforward:
- Create a hypothesis — “Changing the button color from blue to green will increase clicks”
- Build two versions — Control (A) keeps the original, Variant (B) has the change
- Split traffic randomly — 50% sees A, 50% sees B
- Measure results — Track conversions for each version
- Declare a winner — Pick the version with better performance
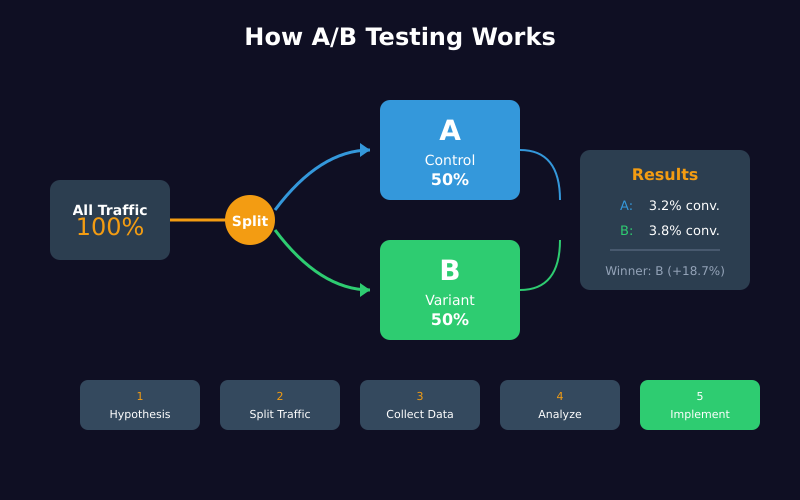
This sounds easy. Unfortunately, each step hides potential pitfalls that can completely invalidate your results.
The Statistical Significance Problem
Here’s where most A/B tests go wrong: people don’t understand what “statistical significance” actually means.
Statistical significance tells you the probability that your results occurred by chance. A 95% confidence level means there’s only a 5% chance that the difference you observed was random noise.
However, this doesn’t mean what most people think it means.
What 95% Confidence Actually Means
A common misconception is that 95% confidence means “there’s a 95% chance the winning variant is actually better.” That interpretation is incorrect.
Instead, it means: “If there were no real difference between A and B, you’d see results this extreme only 5% of the time.”
This distinction matters. Even with 95% confidence, you can still be wrong. In fact, if you run 20 tests where there’s no real difference, you’ll likely get one false positive purely by chance.
Understanding P-Values in A/B Testing
The p-value is the engine behind statistical significance. It answers a single question: assuming the null hypothesis is true (no real difference between A and B), how likely are you to see results at least this extreme?
A p-value of 0.05 means there’s a 5% chance the observed difference is random noise. Most teams set 0.05 as their threshold and call anything below it “significant.”
That’s a convention, not a law. Microsoft, Google, and Booking publish on much stricter thresholds — Microsoft’s experimentation team has documented why large-scale platforms use p<0.01 for high-stakes decisions. The right threshold depends on the cost of a wrong call. Cheap, reversible changes can tolerate p<0.10. Pricing or checkout changes deserve p<0.01.
The Peeking Problem
The most common A/B testing mistake is checking results too early and stopping when they look good.
Suppose you’re running a test and after three days, version B shows a 15% improvement with 92% confidence. It’s tempting to declare victory and implement the change.
Don’t do it.
Early results are unreliable because they’re based on insufficient data. Consequently, the “winning” variant often regresses to the mean once you collect more data. What looked like a 15% improvement might turn out to be noise.
This phenomenon is called “peeking” or “optional stopping,” and it dramatically increases your false positive rate. If you check results daily and stop whenever significance is reached, your actual false positive rate can exceed 30% — far higher than the 5% you think you have.
How Much Traffic Do You Actually Need?
Before running any test, calculate your required sample size. Tools like Evan Miller’s sample size calculator make this easy. The calculation depends on three factors:
- Baseline conversion rate — Your current conversion rate
- Minimum detectable effect (MDE) — The smallest improvement worth detecting
- Statistical power — The probability of detecting a real effect (typically 80%)
Sample Size Reality Check
Here’s what most people don’t realize: detecting small improvements requires enormous sample sizes.
For example, if your baseline conversion rate is 3% and you want to detect a 10% relative improvement (from 3% to 3.3%), you need approximately 50,000 visitors per variant — 100,000 total.
If you only get 10,000 visitors per month, that’s a 10-month test. For most businesses, this is impractical.
As a result, you have two options:
- Test bigger changes — A 50% relative improvement (3% to 4.5%) requires only about 4,000 visitors per variant
- Accept the limitations — Recognize that small optimizations are undetectable with your traffic
Minimum Viable Sample Sizes
As a general guideline, aim for these minimums:
| Metric | Minimum Recommended |
|---|---|
| Visitors per variant | 30,000+ |
| Conversions per variant | 300+ |
| Test duration | 2 weeks minimum |
| Maximum duration | 6-8 weeks |
If you can’t reach these thresholds, your test results will be unreliable regardless of what the statistics say. For lower-traffic sites, qualitative methods and established landing page best practices often produce faster wins than underpowered experiments.
How Long Should You Run an A/B Test?
Test duration matters for two reasons: sample size and capturing behavioral patterns.
The Two-Week Minimum
Always run tests for at least two full weeks, even if you reach statistical significance earlier. This is because user behavior varies by day of week. Monday visitors behave differently than Saturday visitors.
If you run a test for only 5 days, you might miss important patterns. For instance, your variant might perform well on weekdays but poorly on weekends — something you’d never discover with a short test.
The Maximum Duration Problem
On the other hand, don’t let tests run too long. After 6-8 weeks, external factors start contaminating your results:
- Seasonality effects
- Marketing campaigns that affect traffic quality
- Competitor actions
- Technical changes to your site
Therefore, if you can’t reach significance within 8 weeks, the effect you’re testing for probably doesn’t exist — or it’s too small to matter.
A/B vs Multivariate vs Bandit Testing
A/B testing is one tool in a broader experimentation toolkit. The right method depends on traffic, goals, and how many elements you’re trying to evaluate.
| Method | What It Tests | Traffic Required | Statistical Rigor | Best For |
|---|---|---|---|---|
| A/B Testing | One change vs control | Moderate (10k+/variant) | High | Single hypothesis, clear winner needed |
| Multivariate (MVT) | Multiple elements simultaneously | Very high (100k+) | High, with caveats | Layout combinations on high-traffic pages |
| Multi-Armed Bandit | Many variants, auto-allocates traffic | Low to moderate | Lower (sacrifices learning for revenue) | Time-sensitive campaigns, headlines, ads |
| Split URL Test | Entire pages on different URLs | Same as A/B | High | Major redesigns, different templates |
In practice, A/B testing is the default. Multivariate testing only makes sense at scale — most sites simply don’t have the traffic for it. Bandits are popular for ad copy and headlines where the cost of showing a losing variant is high, but they don’t give you the clean lift estimate a proper A/B test does.
Frequentist vs Bayesian A/B Testing
There’s a quieter debate underneath every A/B testing tool: which statistical framework runs the math? Most platforms still default to frequentist methods (p-values, confidence intervals, fixed sample size). A growing number — VWO, Convert, Statsig — offer Bayesian alternatives that report probability statements like “92% chance B is better than A.”
| Aspect | Frequentist | Bayesian |
|---|---|---|
| Core output | P-value, confidence interval | Posterior probability, credible interval |
| Sample size | Fixed in advance | Can stop when posterior stabilizes |
| Peeking | Inflates false positive rate | Less sensitive (but not immune) |
| Interpretation | “5% chance of false positive if there’s no real effect” | “92% probability B beats A given the data” |
| Prior knowledge | Ignored | Encoded in prior distribution |
| Best for | Regulated decisions, auditable methodology | Lower-traffic sites, faster iteration |
Both frameworks work when used correctly. The Bayesian approach is more intuitive — most people naturally think in probabilities, not p-values — but it’s not a free pass to peek. Booking.com has published extensively on running large-scale frequentist experiments with variance reduction techniques, while many product-led companies prefer Bayesian for early-stage features.
The choice rarely matters at small scale. What matters is committing to one framework, sticking to it for the test’s duration, and not switching when results look bad.
Common A/B Testing Mistakes
Beyond statistical errors, several practical mistakes undermine A/B tests:
1. Testing Too Many Variants
Each additional variant increases the traffic you need. A test with 4 variants requires roughly 4x the traffic of a simple A/B test.
Moreover, testing multiple variants increases your false positive risk. If you’re comparing one control against three variants, you’re essentially running three tests simultaneously.
Stick to one variant unless you have massive traffic.
2. Changing Things Mid-Test
Never modify your test after it starts. This includes:
- Adjusting the traffic split
- Editing the variant design
- Changing the goal metric
- Adding new audience segments
Any mid-test change invalidates your results. If you must make changes, start a new test.
3. Ignoring Sample Ratio Mismatch
Sample Ratio Mismatch (SRM) occurs when traffic isn’t split evenly between variants. Even a 0.2% difference can skew results.
Before analyzing results, verify that each variant received approximately equal traffic. If one variant got significantly more or less traffic than expected, something went wrong with your test setup — usually a tracking bug, a redirect that fires unevenly, or bot traffic hitting one variant. SRM is the canary that tells you to stop and audit your GA4 event tracking before trusting any results.
4. Testing the Wrong Things
Button colors, headline tweaks, and minor copy changes rarely produce meaningful results. These micro-optimizations typically generate effects too small to detect reliably.
Instead, focus on bigger changes:
- Different value propositions
- Entirely new page layouts
- Removing major friction points
- Adding or removing entire sections
Bold changes are easier to detect and more likely to produce meaningful business impact. Use funnel analysis to identify the steps where users actually abandon — those are the pages worth testing.
5. Not Having a Hypothesis
Random testing wastes time. Before each test, articulate:
- What you’re changing
- Why you expect it to work
- What success looks like
Without a hypothesis, you’re just guessing. Even if you get a “winner,” you won’t understand why it won — making it impossible to apply the learning elsewhere.
What to Do When Tests Fail
Most A/B tests don’t produce statistically significant results. This isn’t failure — it’s learning.
When a test shows no significant difference, consider:
- The change was too small — Your variant wasn’t different enough to affect behavior
- The hypothesis was wrong — Your assumption about user behavior was incorrect
- The sample was too small — You didn’t have enough traffic to detect the effect
Additionally, a “losing” test is still valuable. It tells you that a particular change won’t improve your conversion rate — information that prevents wasted development effort.
When A/B Testing Isn’t Worth It
A/B testing requires significant traffic and resources. Here’s when you should skip it:
- Low traffic sites — If you get fewer than 10,000 visitors per month, most tests will be inconclusive
- Low-stakes decisions — Testing a footer link isn’t worth the effort
- Obvious improvements — If your checkout is broken, fix it. Don’t test it.
- One-time events — You can’t A/B test a product launch
In these cases, use best practices, qualitative research, and common sense instead. Qualitative methods (interviews, usability tests, session recordings) help you understand why users behave certain ways. Use these to generate hypotheses, then validate with A/B tests when traffic allows. Similarly, analyzing bounce rate patterns can reveal which pages need testing most urgently.
Tools for A/B Testing
Several platforms can run A/B tests:
| Tool | Best For | Starting Price |
|---|---|---|
| Google Optimize (sunset) | Was free, now discontinued | N/A |
| VWO | Mid-market companies | ~$200/month |
| Optimizely | Enterprise | Custom pricing |
| AB Tasty | European companies | Custom pricing |
| Convert | Privacy-focused testing | ~$99/month |
| Statsig | Product-led teams (Bayesian) | Free tier + usage-based |
Most tools handle the technical implementation, but none of them prevent statistical mistakes. That’s on you. Before launching, preview the variant copy with a tool like the SERP preview if the change touches titles or descriptions surfaced in search.
A Practical A/B Testing Checklist
Before running your next test, verify:
- Hypothesis documented — Clear statement of what you expect and why
- Sample size calculated — Know how many visitors you need before starting
- Test duration planned — Minimum 2 weeks, maximum 8 weeks
- Success metric defined — One primary metric, decided in advance
- Technical setup verified — Equal traffic split, tracking working correctly
- No peeking commitment — Decide not to check results until the planned end date
- SRM check planned — Confirm traffic split matches expectation before reading results
If you can’t check all these boxes, you’re not ready to run a valid test.
Frequently Asked Questions
What sample size do I need for an A/B test?
It depends on your baseline conversion rate and the smallest improvement you want to detect (MDE). A site with a 3% baseline conversion rate needs roughly 50,000 visitors per variant to detect a 10% relative lift at 95% confidence and 80% power. Smaller lifts need exponentially more traffic. Use Evan Miller’s calculator before launching, not after.
How long should I run an A/B test?
A minimum of two full weeks, regardless of when you hit significance. This captures full weekly behavioral cycles. Cap tests at 6-8 weeks — beyond that, seasonality, marketing campaigns, and product changes contaminate the results. If you haven’t reached significance in 8 weeks, the effect is either too small to matter or doesn’t exist.
What’s the difference between statistical significance and practical significance?
Statistical significance tells you the difference probably isn’t due to chance. Practical significance tells you whether the difference is large enough to act on. A 0.3% lift can be statistically significant with enough traffic but not worth the engineering cost to ship. Always define a minimum detectable effect that’s worth your time before starting.
Can I trust an A/B test that ran for only 3 days?
No. Three days doesn’t capture weekly behavior cycles, sample sizes are usually too small, and stopping early (“peeking”) inflates your false positive rate to 20-30%. A “winner” after 3 days frequently regresses to the mean once you collect more data.
Is Bayesian A/B testing better than frequentist?
Neither is objectively better — they answer slightly different questions. Frequentist methods report p-values and require a fixed sample size. Bayesian methods report probability statements and allow more flexible stopping. Bayesian is often more intuitive for non-statisticians; frequentist is the standard in regulated environments. Pick one framework and commit to it for the duration of each test.
What is Sample Ratio Mismatch (SRM) and why does it matter?
SRM occurs when traffic isn’t split as expected — for example, you set 50/50 but Variant A got 51.2% of visitors. Even small mismatches signal a setup problem: a tracking bug, a redirect firing unevenly, bot traffic, or browser caching issues. SRM invalidates the test entirely. Run a chi-square SRM check before reading any results.
How do I A/B test on a low-traffic site?
Honestly, you usually can’t get meaningful A/B test results below 10,000 visitors per month. Instead: test bigger, bolder changes (full redesigns, new value propositions); rely on qualitative research and usability testing; benchmark against published conversion rate benchmarks; or batch changes and monitor pre/post effects directionally without claiming statistical significance.
The Bottom Line
A/B testing is a powerful tool, but it’s frequently misused. Most “data-driven” decisions based on A/B tests are actually noise dressed up as insight.
The solution isn’t to abandon testing. Instead, it’s to test properly: calculate sample sizes in advance, run tests long enough, resist the urge to peek, and accept that most tests won’t produce significant results.
Ultimately, a rigorous A/B testing program teaches you more from the failures than from the wins. The goal isn’t to find winners — it’s to learn the truth about what actually affects your users’ behavior.
That requires patience, discipline, and a willingness to be proven wrong.