Your GA4 report says 420 conversions last month. Google Ads says 510. Meta Ads says 380. The CRM database has 445. None of these numbers are wrong — they’re measuring different things on different clocks with different assumptions, and that analytics data discrepancy is not only normal, it’s mathematically unavoidable given how modern tracking works. The question isn’t how to make them match. It’s how to know which one to trust for which decision.
In this guide, I’ll explain the seven reasons these numbers diverge, how to calibrate expectations so your marketing team stops arguing about “the right number,” and which number to report against for which purpose. I’ve walked dozens of teams through this problem, and the pattern is remarkably consistent once you see it.
Why Analytics Numbers Never Match
Before diving into specifics: a 20-30% gap between GA4 and ad platforms is normal. A gap under 10% is suspiciously clean (probably under-tagged). A gap over 50% usually means a specific implementation bug worth investigating. The gap itself is fine; the behavior that causes it is deterministic.
Seven root causes produce almost all real-world discrepancies:
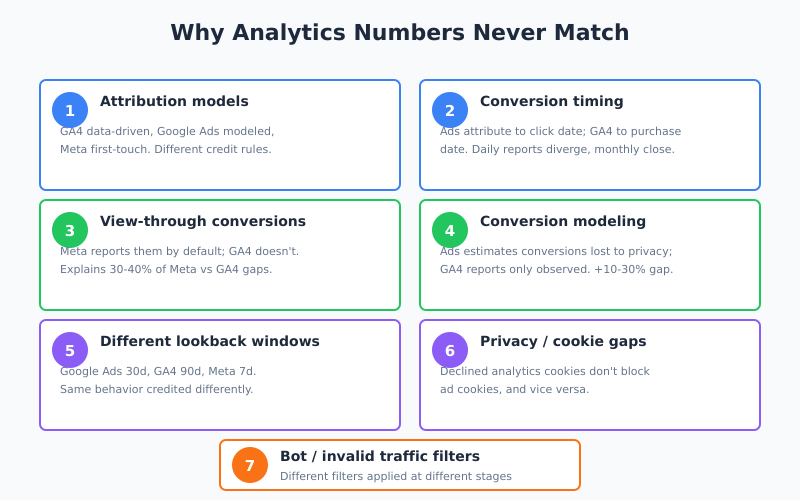
1. Different Attribution Models
GA4 defaults to a data-driven attribution model; Google Ads defaults to data-driven attribution as well, but applied over different data with different inputs. Meta Ads uses its own attribution. Each platform gives credit to clicks differently.
Specifically, a purchase that came from an organic search session preceded by a paid ad click three days earlier might get credit attributed to paid in Google Ads, organic in GA4, and to paid again (but partially) in Ads if you set GA4 to last-click. Same purchase, three different attribution answers. For context on why attribution is this messy, see marketing attribution and why it’s getting harder.
2. Conversion Timing
Google Ads attributes conversions to the date of the click that led to the eventual purchase. GA4 attributes conversions to the date of the purchase itself. If a user clicks a Monday ad and purchases on Thursday, Google Ads reports it on Monday; GA4 reports it on Thursday.
This creates temporary gaps in day-over-day reports that close over longer time windows. Monthly totals are closer than daily totals. Weekly totals fall in between. Never compare single-day numbers across platforms and expect them to match.
3. View-Through Conversions
Google Ads and Meta Ads track view-through conversions by default — conversions from users who saw an ad but didn’t click. GA4 tracks click-through conversions primarily. Meta Ads especially over-reports by this mechanism; in my experience, 30-40% of Meta’s reported conversions are view-through, and they simply don’t exist in GA4.
Specifically, if Meta Ads reports 500 conversions and GA4 reports 300 for the same campaign, roughly 200 of Meta’s are likely view-through. That’s not a bug in either platform; it’s a different definition.
4. Conversion Modeling
When cookies aren’t available (privacy consent refused, ad blockers, cross-device gaps), Google Ads uses conversion modeling to estimate conversions that would have happened if tracking worked perfectly. These modeled conversions show up in Google Ads but not in GA4, because GA4 only reports observed data.
In practice, this can add 10-30% to Ads-reported conversions that have no matching entries in GA4. Google calls this an enhancement; critics call it an invented number. Both perspectives have merit. The right stance is to use modeled conversions for trend analysis but observed data for precise reconciliation.
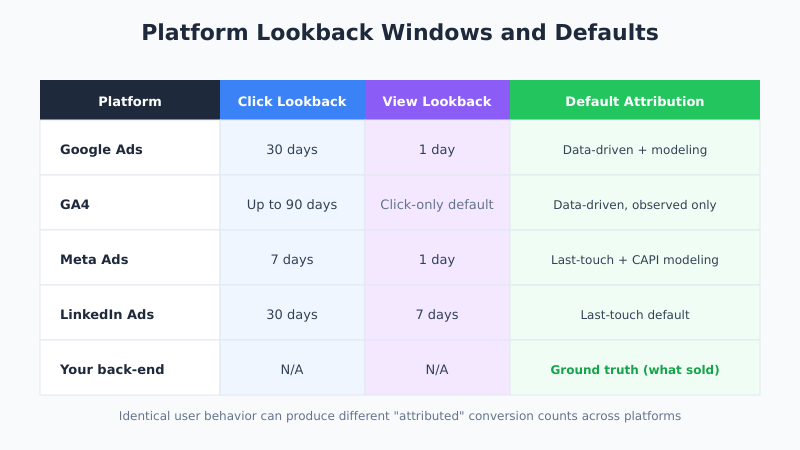
5. Lookback Window Differences
| Platform | Default Click Lookback | Default View Lookback |
|---|---|---|
| Google Ads | 30 days | 1 day |
| GA4 | Up to 90 days (data-driven) | N/A (click-only default) |
| Meta Ads | 7 days | 1 day |
| LinkedIn Ads | 30 days | 7 days |
A user who converts 14 days after a Meta click isn’t attributed to Meta; the same user converting 14 days after a Google Ads click is. Different windows mean different conversion credits for identical user behavior.
6. Privacy and Cookie Restrictions
If a user declines analytics cookies but accepts advertising cookies, Google Ads can track the interaction and GA4 cannot. The opposite also happens. Consent mode attempts to bridge this with modeling, but the raw data gap is real. In EU traffic this can account for 20-40% of the divergence. Teams that find this gap unacceptable often look at how cookieless analytics works as a way to reduce their reliance on consent in the first place.
7. Invalid Traffic Filtering
All platforms filter bots and invalid traffic — but they apply different filters at different stages. Google Ads typically has the most aggressive filtering. Meta Ads is moderate. GA4 is lighter. A visitor counted as “human” by GA4 might be filtered as “invalid” by Google Ads and never reach either report.
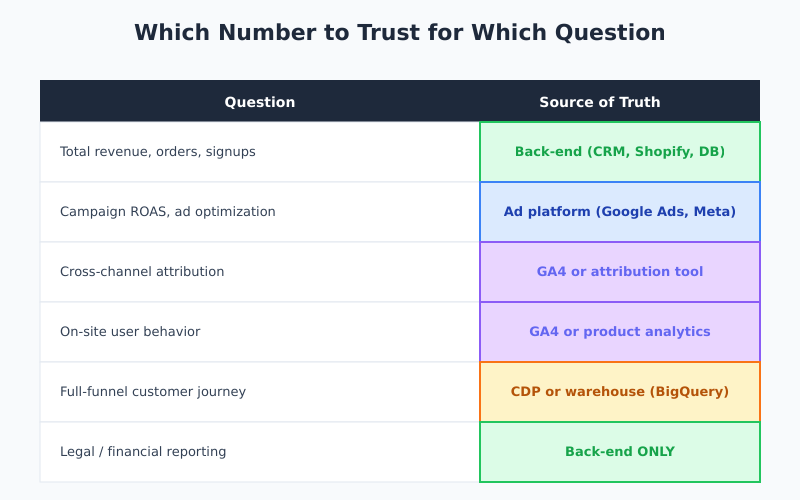
Which Number to Trust for What
Here’s the practical framework I use. It stops the “which number is right” argument by reframing it as “which number answers this question.”
| Question You’re Answering | Source of Truth |
|---|---|
| Total revenue / orders / signups | Your back-end system (CRM, database, Shopify admin) |
| Campaign ROAS and ad optimization | Ad platform (Google Ads, Meta Ads, LinkedIn) |
| Cross-channel attribution | GA4 or a dedicated attribution tool |
| User behavior on-site | GA4 (session-level) or product analytics |
| Full-funnel customer journey | CDP or warehouse (Snowflake, BigQuery) |
| Legal / financial reporting | Back-end system ONLY — never a tracking tool |
Specifically, your e-commerce backend is the only source for “how many orders did we actually ship.” Every other tool estimates. Your ad platforms are the source for “should we increase this campaign’s budget.” GA4 is the source for “what are users doing on the site.” Don’t mix them up.
How to Explain Discrepancies to Stakeholders
This is where most analytics teams lose political capital. The CFO asks “why do the numbers differ” and gets a 40-minute technical answer. The real answer is three sentences:
- “Each platform measures a slightly different thing using slightly different rules.” A user’s purchase can count on multiple platforms with different timing and different credit. That’s expected behavior.
- “For revenue numbers, trust the back-end system. It’s the only one that knows what we actually sold.” GA4 and ad platforms are optimization tools, not accounting tools.
- “We use each tool for the question it’s best at answering.” Then walk through the table above.
Once stakeholders accept that discrepancies are normal, debates shift from “which number is right” to “which trend are we responding to,” which is the actually useful conversation. The same lesson applies to any cross-system data signal: rigid one-true-answer thinking gives way to schema-with-context, an arc the schema validation evolution traces from RelaxNG strictness toward flexible JSON-LD graphs that tolerate platform-by-platform variation.
When Discrepancies Indicate Real Bugs
Not every gap is normal. These specific patterns should trigger an audit:
- GA4 reports 50%+ more conversions than Google Ads on paid campaigns. Usually duplicate event firing or counting view_item as a conversion. Check GA4 key event setup.
- GA4 reports 80%+ fewer conversions than Google Ads. Usually missing or broken GA4 event firing on the thank-you page.
- Meta Ads shows 2-3x GA4 conversion numbers with most being view-through. Normal but review whether view-through is still informative given iOS 14+ limitations. Consider switching Meta to click-only reporting for strategic decisions.
- Numbers flip overnight in one platform. Usually a tracking pixel got broken or a consent change rolled out without proper testing.
- Direct traffic in GA4 jumps suddenly. Usually UTM parameters got stripped somewhere, collapsing paid traffic into direct. Investigate your UTM tagging.
In practice, healthy variance is 10-30% between GA4 and Google Ads, 30-50% between GA4 and Meta Ads (due to view-through), and 5-15% between GA4 and your back-end system (due to event-firing gaps and bot filtering). Deviations from these ranges are investigation triggers.
Reconciliation Workflow
Quarterly, I run this reconciliation to keep teams aligned:
- Pull the same metric from all three platforms (GA4, Google Ads, back-end system) for the previous full month.
- Calculate variance percentages between each pair. Record in a spreadsheet.
- Compare to historical variance. Variance should be stable quarter-over-quarter. Sudden changes mean something broke.
- Sample-match 20-30 conversions. Pull order IDs from the back-end and check whether they exist in GA4 and Google Ads. This reveals systematic gaps.
- Document the “normal” variance range and share with stakeholders. Now when someone asks “why is GA4 18% lower than Ads?” you point to the historical baseline instead of re-explaining.
For broader coverage of how user counts diverge, see also what a GA4 session actually is, since session counting differences alone can account for part of the gap.
What Not to Do
Four common reactions to discrepancy that make things worse:
- Don’t pick one platform and ignore the others. Each is useful for different decisions.
- Don’t pressure engineering to “fix” GA4 until it matches Ads. You can’t. The platforms are measuring different things by design.
- Don’t average the numbers. An average of three misaligned numbers is still a misaligned number, and you lose the information each platform uniquely provides.
- Don’t use GA4 for revenue reporting to leadership. Use the back-end system. GA4’s revenue figures will always have tracking gaps, and a single missed
purchaseevent can make a month look bad.
Specifically, avoid building dashboards that display “the” conversion number without context. Show all relevant numbers side-by-side with their variance ranges. Leadership actually prefers this once they understand it — it demonstrates analytical rigor rather than hiding the complexity. The Ruler Analytics breakdown is a good reference to share with skeptical stakeholders.
Bottom Line
Analytics data discrepancy is not a failure — it’s a feature of having multiple tools that measure slightly different things for slightly different purposes. The fix isn’t to make the numbers match; it’s to understand which platform is the source of truth for which question, calibrate expectations to the historical variance range, and reserve engineering effort for real tracking bugs rather than phantom reconciliation.
Therefore, establish your variance baseline, build a platform-by-question matrix, and train stakeholders on why all three numbers can be simultaneously correct. The teams that accept the discrepancy stop wasting cycles on reconciliation and start making decisions. The teams that chase perfect matches burn months of engineering time on a problem that can’t be solved by design.